
Quick Alert: Belt-Tightening


Rule number #1: Admit when you’re wrong and adapt.
Rule number #2: Don’t fight what the market is telling you. Swim with the flow of money.
Reminder: Avoid concentrating your wealth in individual stocks. For stock investing, allocate at least 80% to a broad index fund and limit stock picking to 20% or less of your portfolio. Beating the market typically requires luck, extensive time and analysis, or insider information. Retail investors are best positioned by investing in longer economic cycles, shifting from index funds to bonds to commodities(i.e. gold) over elognated time horizon to optimize returns and manage risk. “Long Beta, and live your life”—I’ll expand on this in a future letter.
Everyone—and their mother (including me)—assumed that Trump would enter office with one goal: fueling the stock market to new highs, as every president has. We were wrong. It’s common practice for administrations to measure the success of a presidency by the net gain of U.S. markets during their term. Why? Well, you, me, and your neighbor (voters) all have 401(k)s. Numbers go up = happy voters. The opposite has proven to be true. Trump has shocked the market—and frankly, the world.
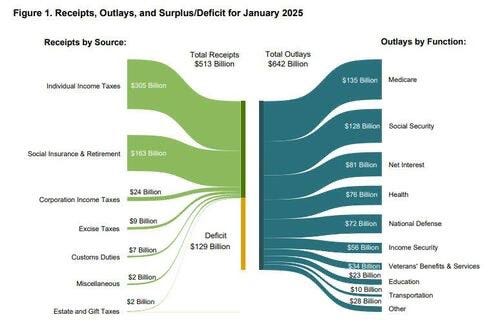
Federal Spending: To understand why, first let’s understand what has been propping up the stock market in the past 2–3 years: federal spending! The Biden administration fueled one of the largest federal spending regimes with bills like the Inflation Reduction Act. These actions act as a stimulus to the economy, boosting investment, profits, and asset prices. When a business (like the federal government) spends more money than it makes, would you want to loan them money? No! So, people, governments, and pensions sold U.S. debt (bonds) and moved their money to risk assets (stocks, crypto, etc.), which is a key reason why interest rates have been so high. Remember, there’s a finite amount of money in the world, and it flows from place to place. No one wants to loan money to a business that’s losing money every month—$129 billion a month… for the U.S. federal government!!! See the image below where reciepts = revenues and outlays = expenses for one month….
Bloomberg News: "Trump has famously obsessed over the stock market as a real-time referendum on his presidency. But now, with Musk and Treasury Secretary Scott Bessent in his ear at the start of his second term, much of the attention has shifted to another benchmark—the 10-year Treasury bond yield."
Austerity: The market didn’t believe Trump had the guts to cut federal spending in an economic theory called austerity. But he has made it clear his mission is not a higher stock market; it’s lower interest rates. And austerity is the only way there. The “Fiscal Dominance” image below illustrates the vicious cycle we’ve been in since 2008. Unless the U.S. economy endures the short-term pain of tightening our belt, the balloon keeps getting bigger. It’s what must be done for our kids’ kids to ever have a chance at economic prosperity, but every president has kicked the can down the road, not wanting to be responsible for crushing asset prices (401(k)s).
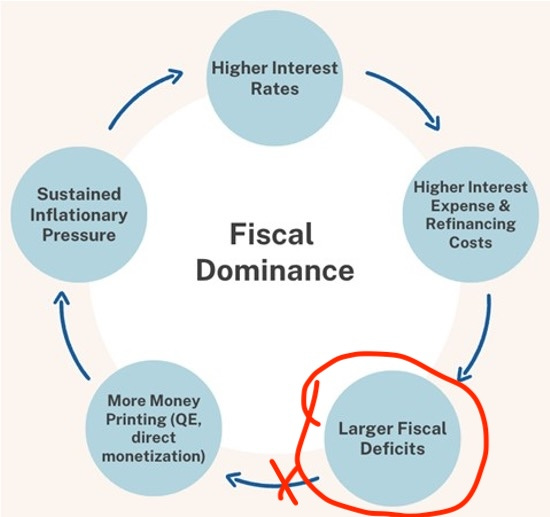
Why? Well, look at the chart below. The green line (M2) is the total supply of dollars in the world (yeah…they printed a lot during COVID). The red line is the net worth of the wealthiest Americans, and the blue line is the middle- to lower-class wealth. All the money printing has been benefiting one class by pouring it into assets, and who owns assets? The wealthy. Money printing (QE) flows into the economy through the purcasing of assets, equities/bonds, which props up markets. So, recall the death spiral image above—what’s the circle to the left of “Larger Fiscal Deficits”, “More Money Printing….”? That’s the critical step that needs to be broken. Austerity does that by reducing the fiscal deficit (government losing money), so that new money doesn’t need to be printed, which would further widen the wealth gap.

Trump’s administration has been on a cost-cutting spree, and it shows no sign of slowing. Moreover, the announced tariffs will also add to the revenue side of the U.S. government business. The market has responded to this change, sending a new, strong signal through the reduction of interest rates. The 10 year yield is down .5% in just one month. The U.S. government for the first time in ~ 20 years could move into a balanced budget (revenue = spending). Now, people, governments, and pensions are interested in loaning the U.S. government money (buying U.S. bonds) again. And what will they sell to buy the debt? Risk assets! This results in interest rates coming down, but stock prices will likely stagnate with limited upside.
Buffet Indicator:
Warren Buffett has spoken for years about his key indicator for U.S. stock market health. The indicator looks at the total market cap of U.S. stocks versus the U.S. Gross Domestic Product. The indicator is a ballpark measure of how expensive stocks are at any one point in history… It’s now sitting at ~210, i.e., 2.1 standard deviations. “If the ratio approaches 200%, as it did in 1999, you are playing with fire.” —W. Buffett . See the curren ratio below, at 211%.


So, what has Buffett been doing? Well, he has been selling stocks at a record level and has raised his cash pile to record levels. Why do we care what Buffett is doing? Making money in the markets is a function of two things: intellect or information. You don’t need both. Buffett manages so much value in assets that he has access to information months and even years before you and me. He famously met with the Japanese Federal Reserve chair and miraculously divested from his Japanese assets before the famous yen carry trade unraveling in 2024.

So, what do we do? Overall, this is a time to be tactical and protect your piggy bank. The austerity cycle will likely take 8–18 months to fully flesh out. In that time, it’s best to store your wealth in stable assets that either earn yield or have constrained supply.
Bullish(Buy): $TLT(US bond etf), Gold, $BTC
Best of Luck and as always DONT SAVE IN DOLLARS.

Great write up. You explained it in simple terms.